Find out more about how this website uses cookies to enhance your browsing experience.
Data is King in Insurance
Insurers and intermediaries possess vast amounts of data which is often constrained within multiple legacy systems and databases.
The ability to efficiently leverage internal and external data to support decision-making is becoming an ever more strategic priority across the whole of the insurance value chain.
IDS ANALYTICS SOLUTIONS
As a team of insurance data specialists, you can trust in our knowledge and abilities to extract and consolidate different data sources together, from policy administration and underwriting, claims, accounts, and telephone systems, to bordereaux spreadsheets and external data from partners and data enrichment sources.
Data feeds and routines to optimise the data can all be automated, ensuring it's available for rich analysis via custom-built dashboards.
|
SSP Electra M3 |
SSP Sirius |
Acturis |
Transactor / Mobius (TGSL) |
| SSP Sector | Websure | Open GI / InfoCentre |
Cheshire Data CDL Classic /Strata |
| SSP Insight | Quindell | TIA | Watertrace / BDX |
| SSP Pure | S2000 | Applied / EPIC | SchemeServe |
| RDT |
Accelerating Operational Efficiency and Data Accuracy
With fully customizable Power BI dashboards built specifically for Brokers and MGA's, we can cost-effectively accelerate your journey to business intelligence.
Wrapping our granular understanding of insurance data around the technology our clients wish to use, with experience in using Tableau and Qlikview also.
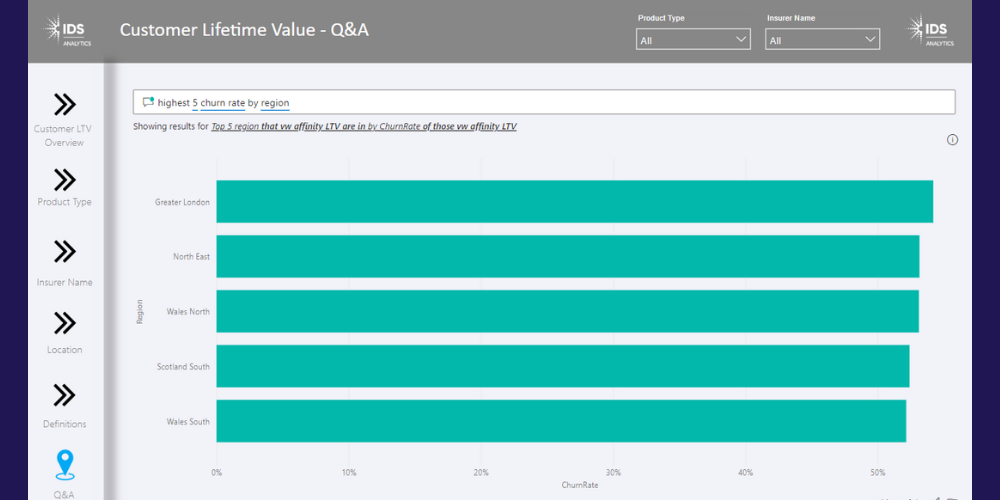
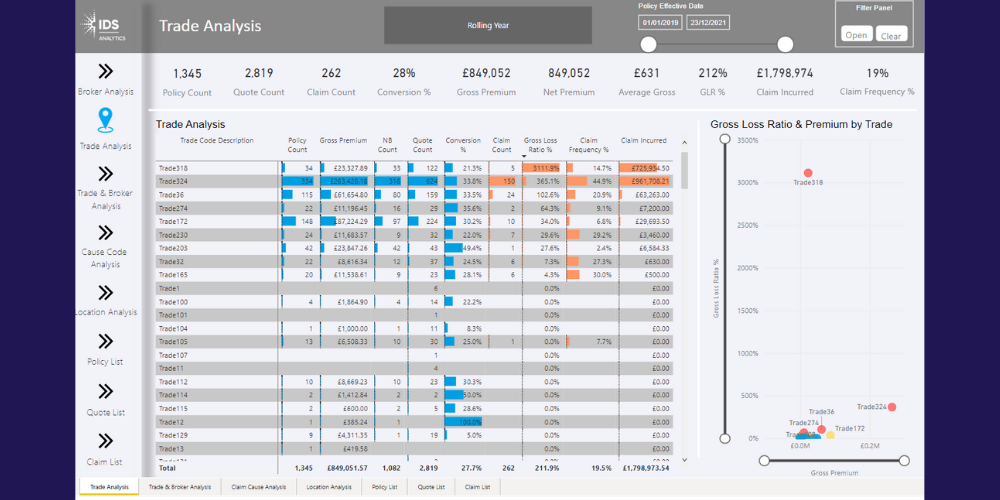

Identify Trends & Outliers and Drill Down to the Detail
The beauty behind data visualization is you can easily see trends and outliers straight away without having to spend hours crunching numbers from spreadsheets.
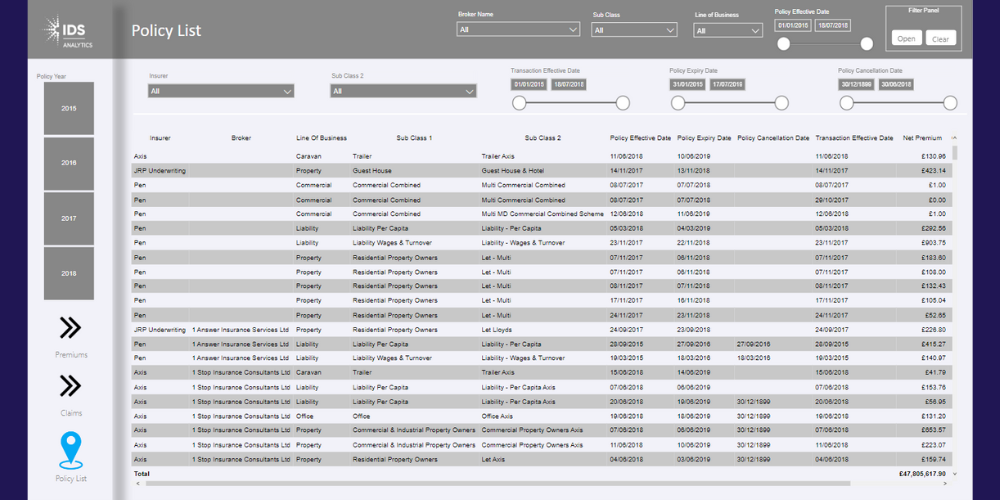
Allowing you to easily filter on a particular branch, specific lines of business, or insurer and drill down into the detail to analyze the underlying policies and claims.
See the benefits of data visualization in the demonstration video opposite.
A Single Source of the Truth
Business Intelligence works most effectively at an enterprise level where data and KPIs can be aligned with operational, strategic, and financial business goals and your data strategy.
Insurance Analytics Dashboards
|
|
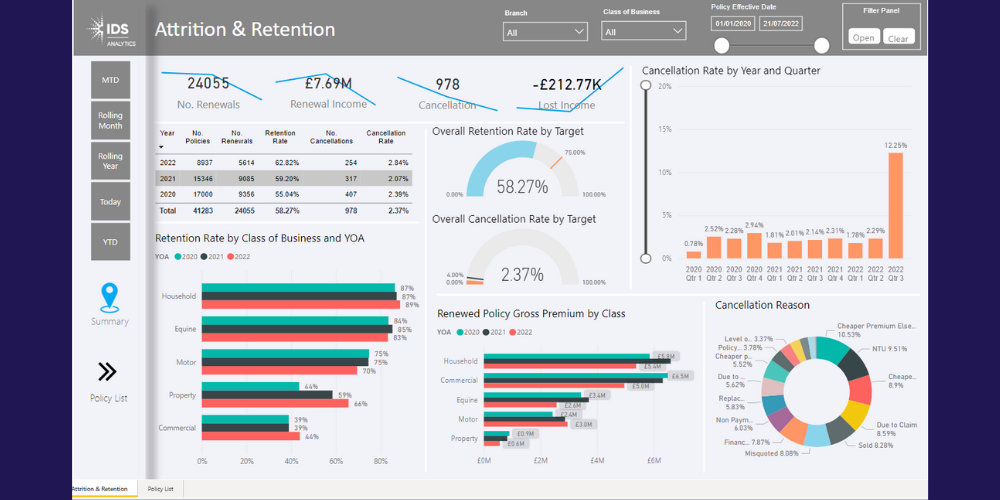
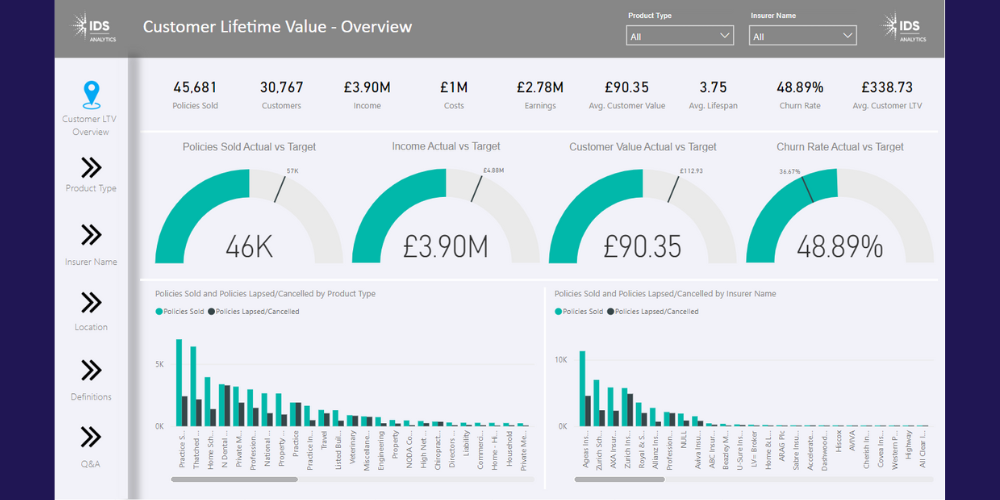
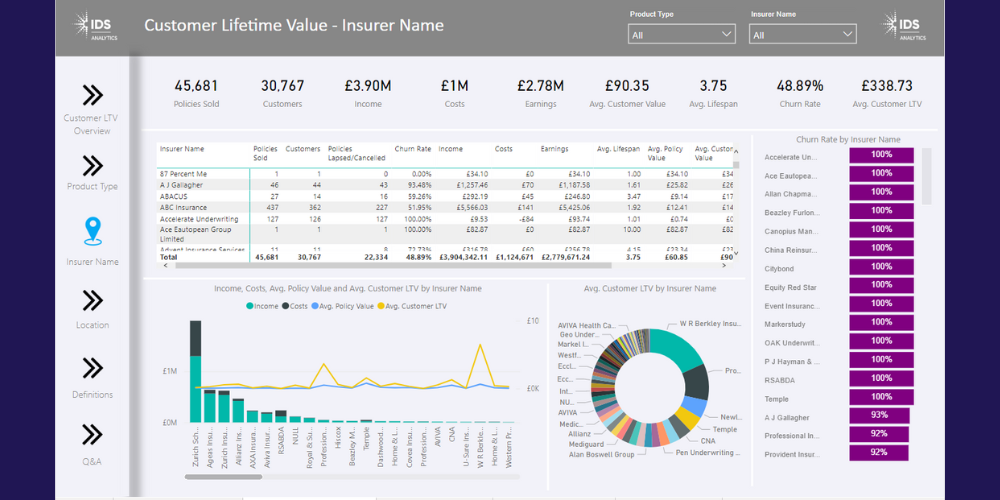
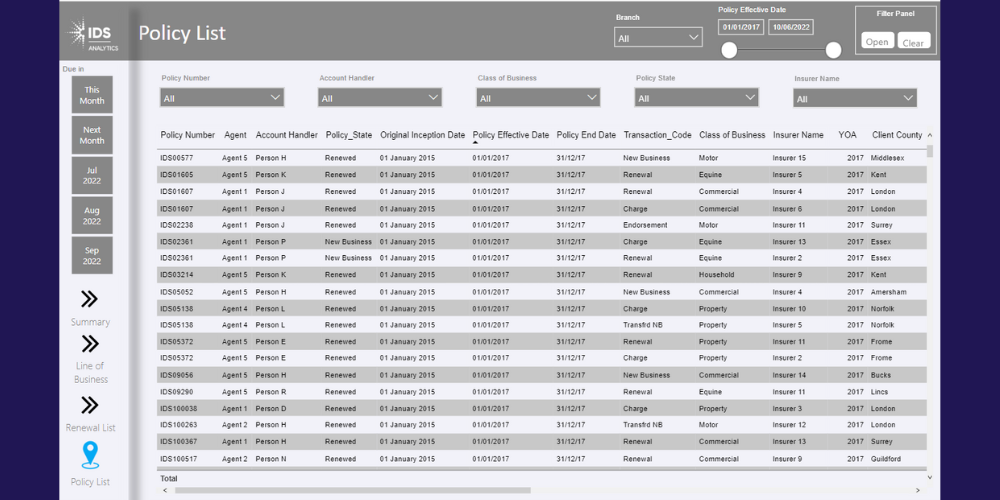
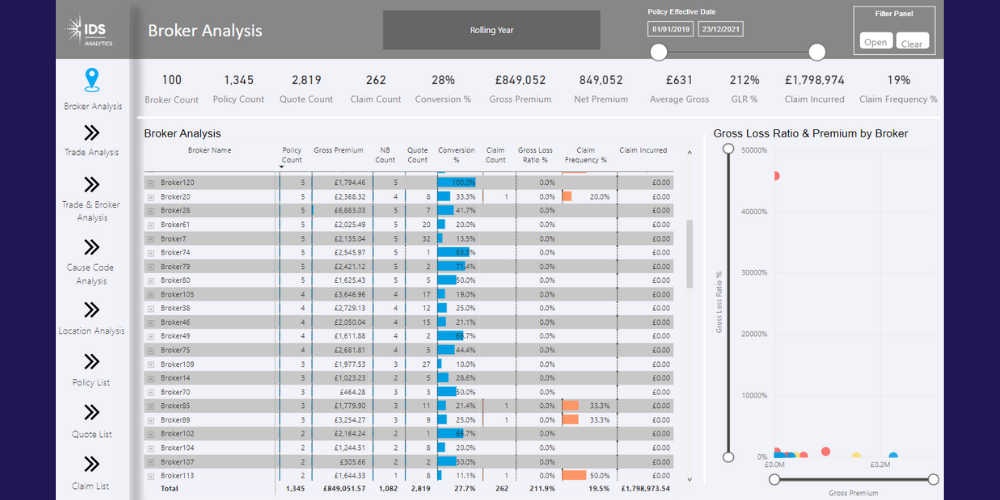
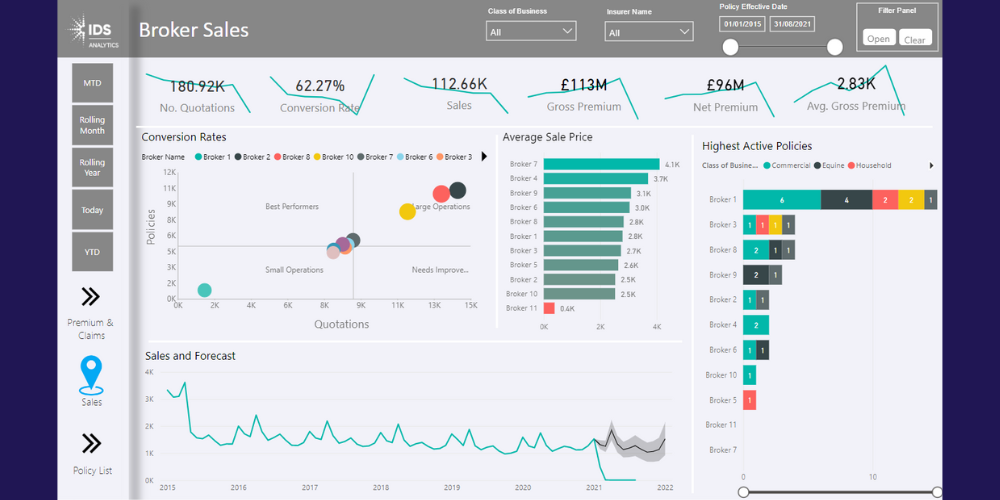
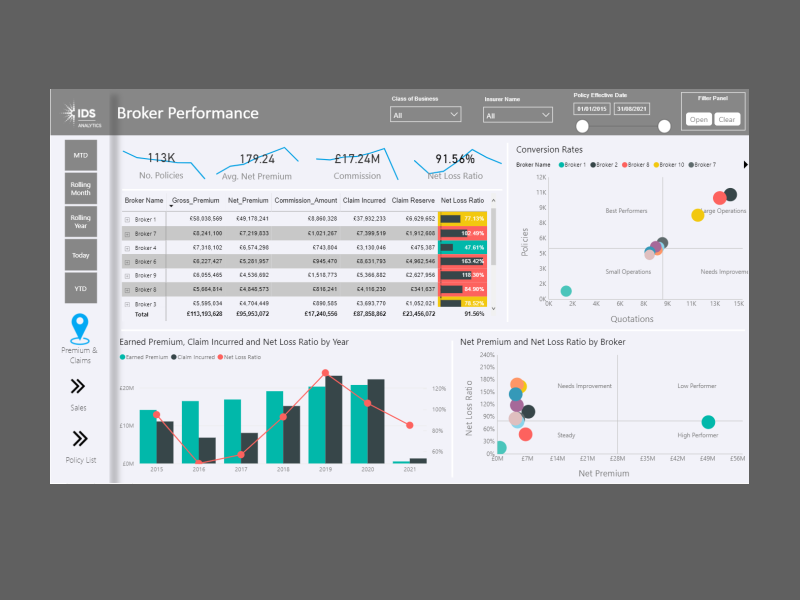
Broker Analytics
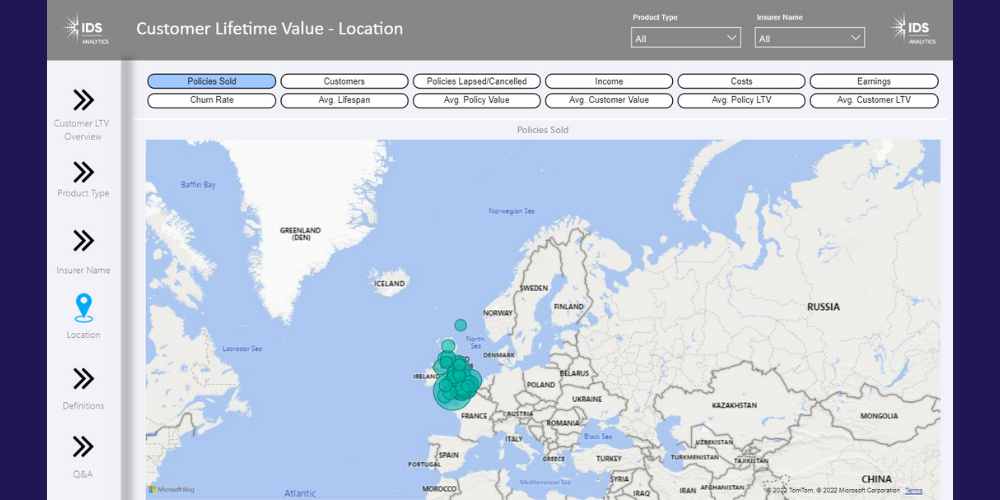
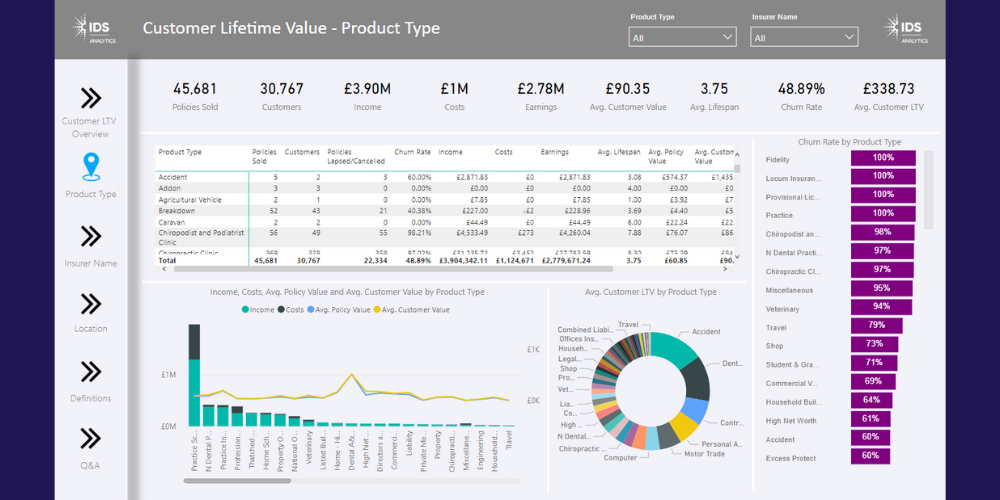
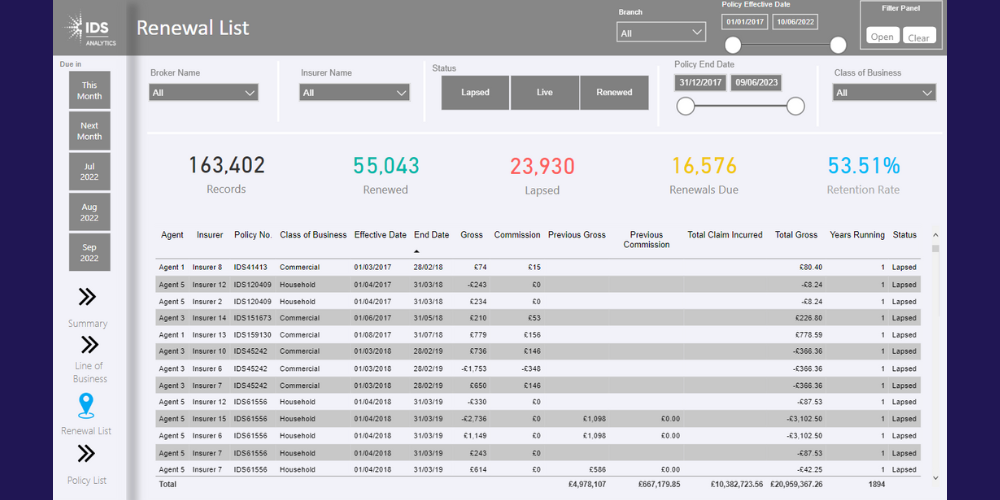
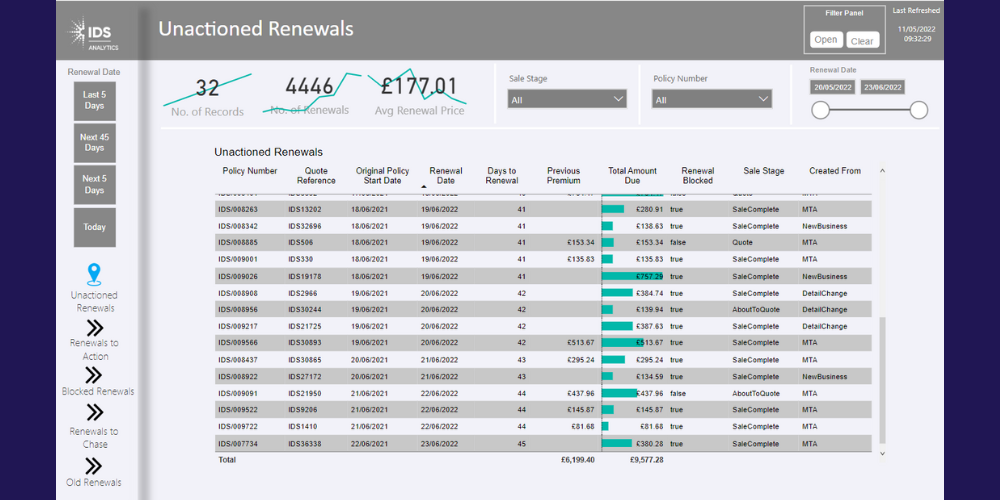
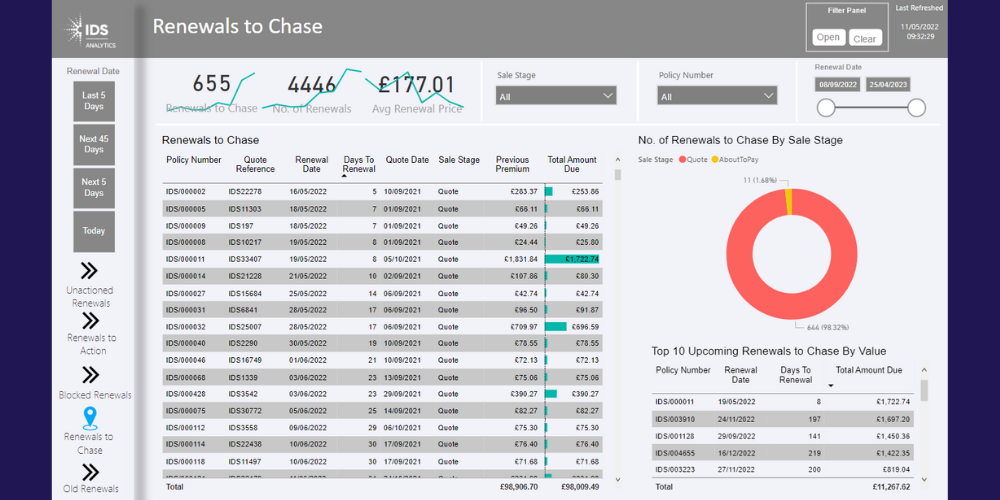
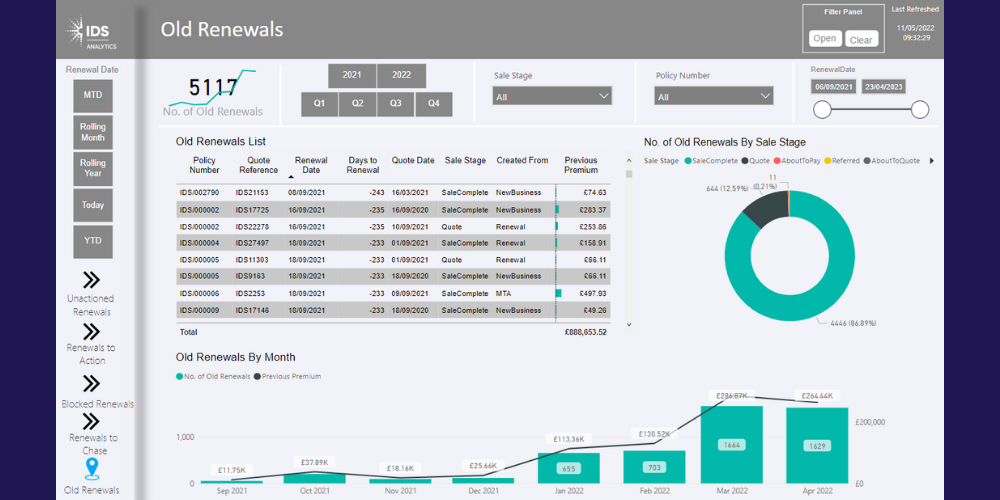
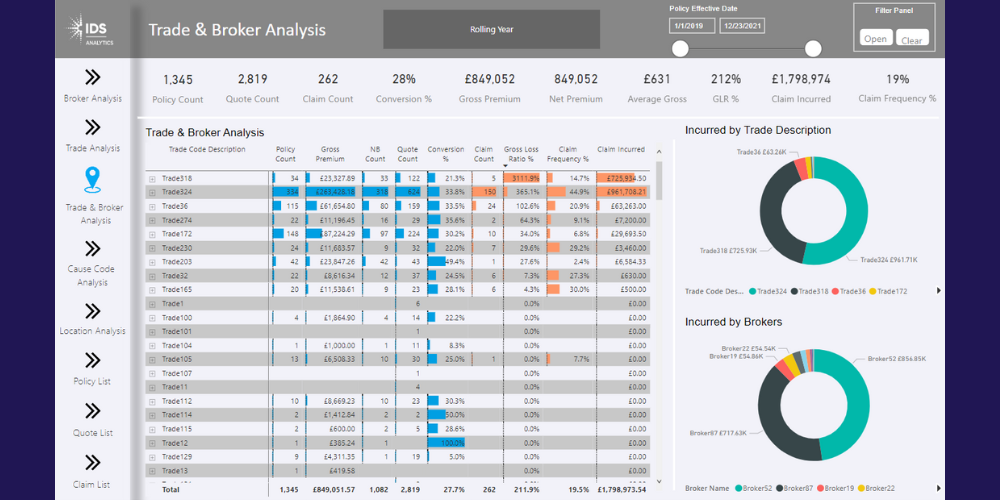
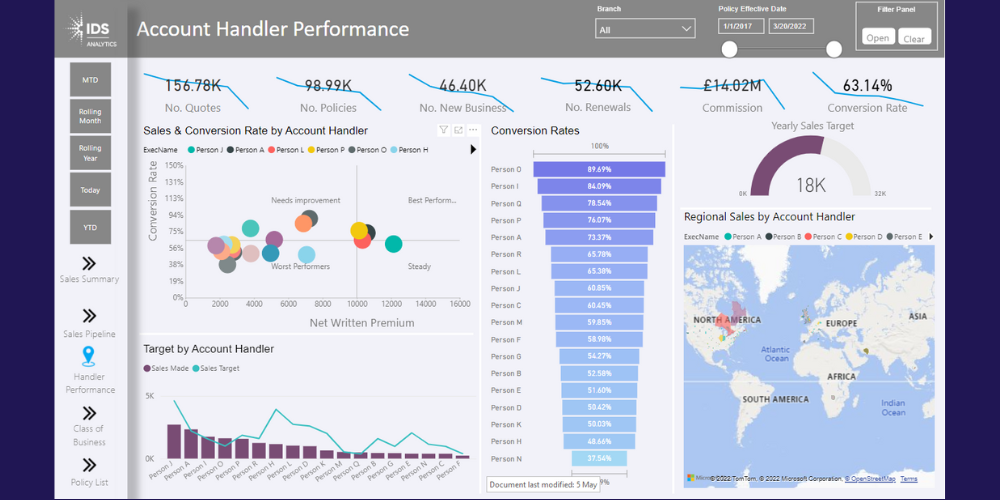
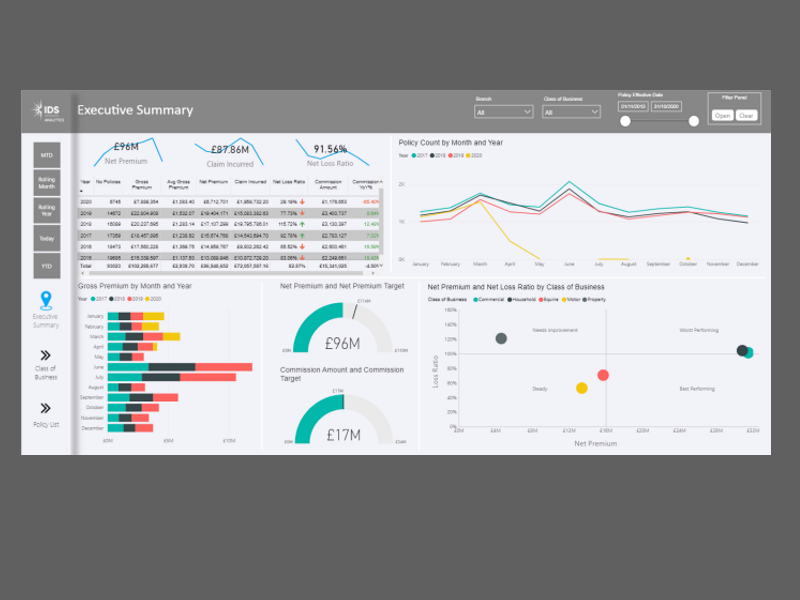
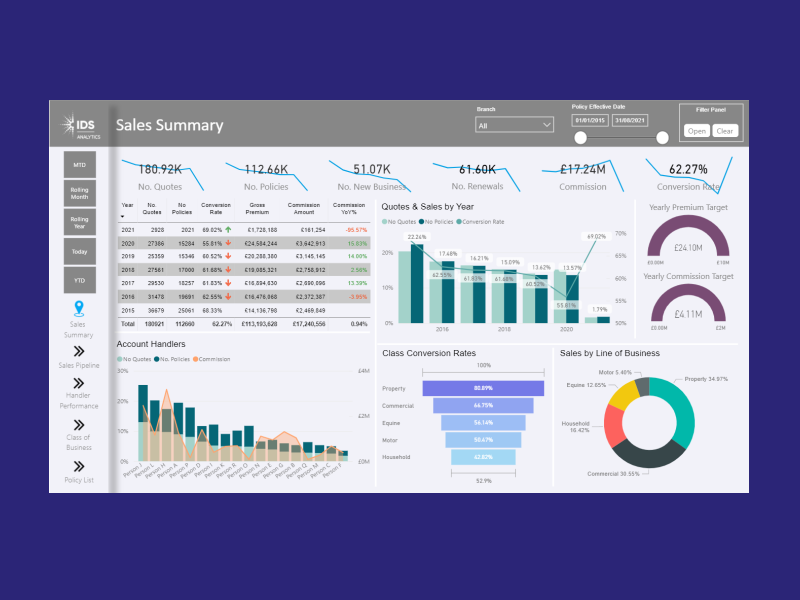
The suite of Broker dashboards and MI offers the ability to track and forecast sales performance against targets across different sectors, by account handler, or any other metric in the data set.
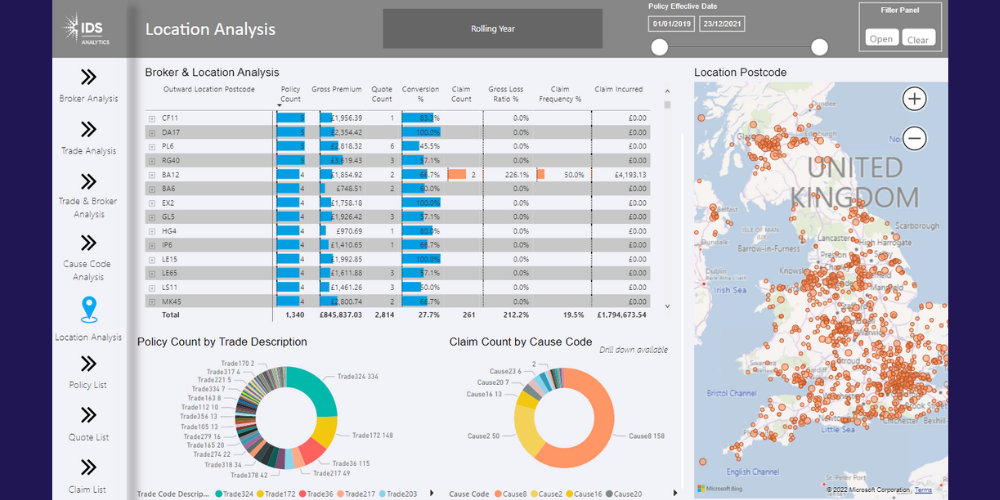
Visualise who and where your customers are across the UK and analyse customer retention and attrition rates to identify where your business can increase customer lifetime value.
Analyse policy income to improve profitability and measure where quote conversion rates are below or above expectations.
Better understand customers with segmentation and enrichment to gain insight and improve marketing.
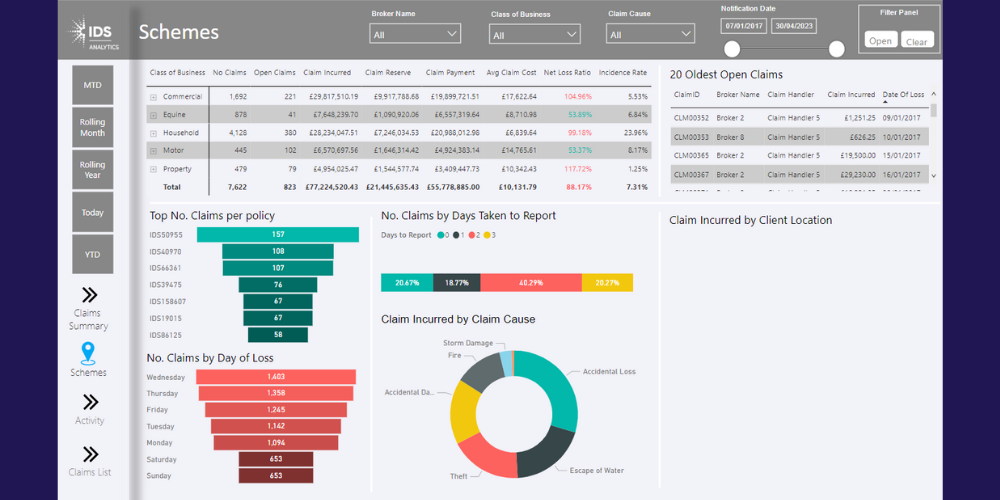
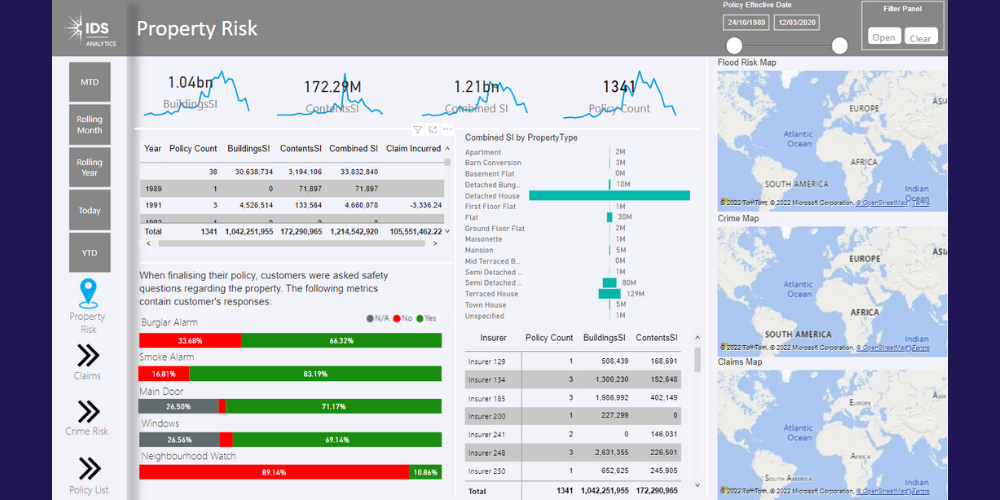
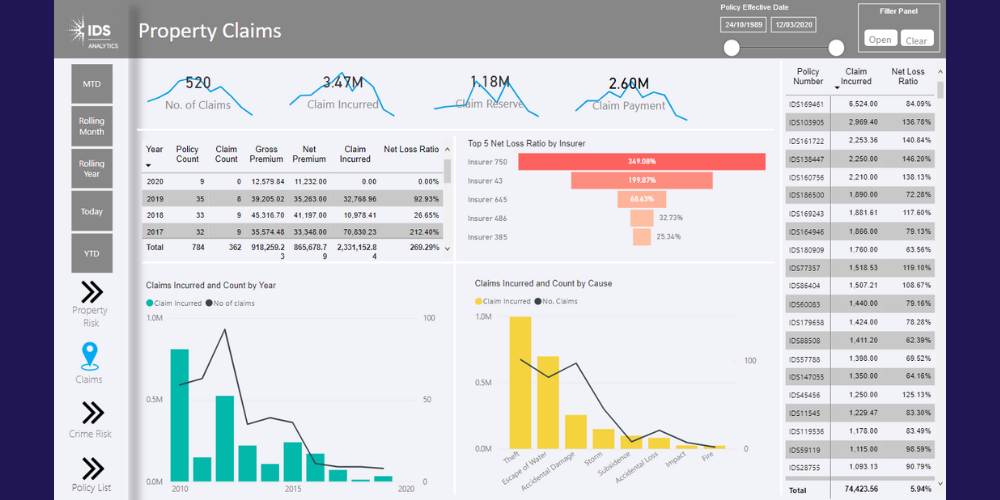
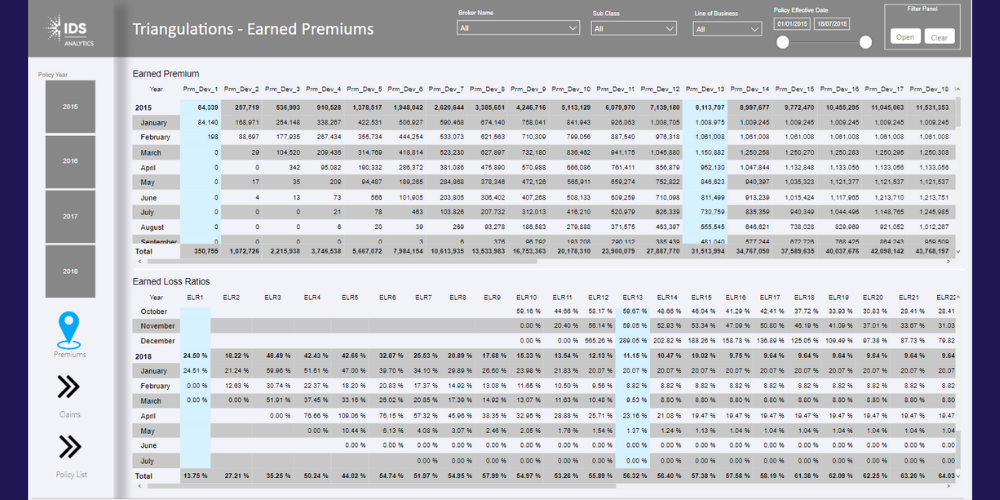
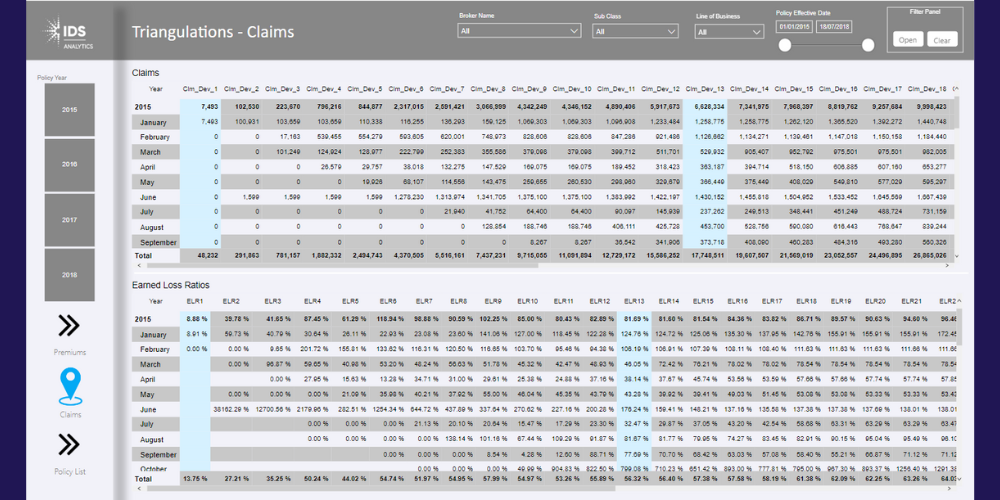
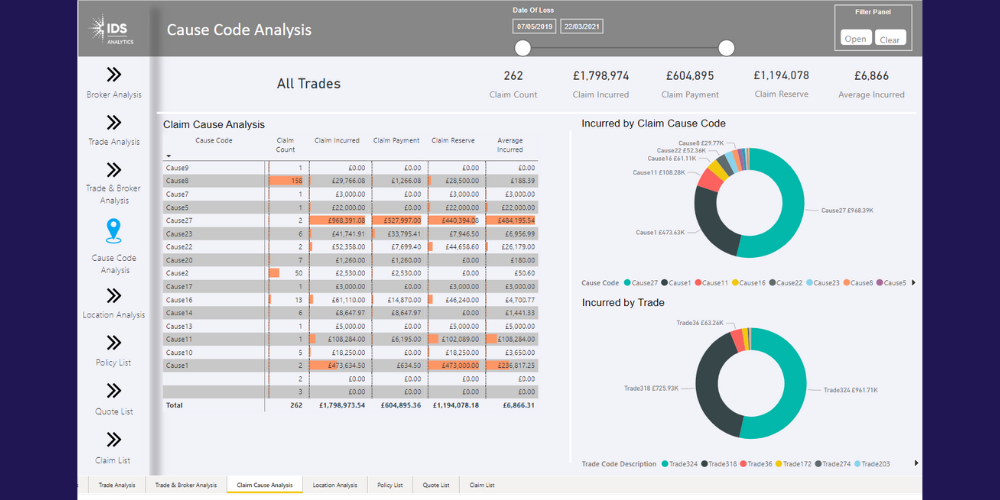
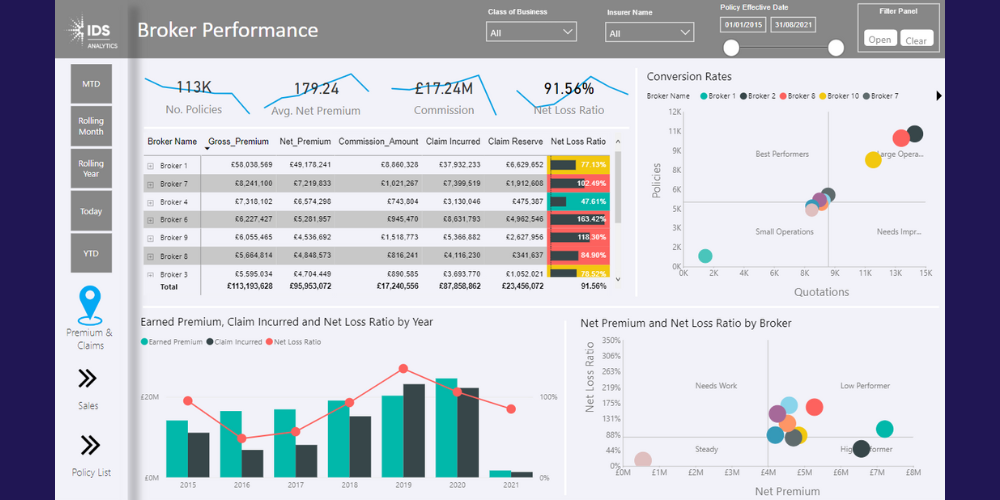
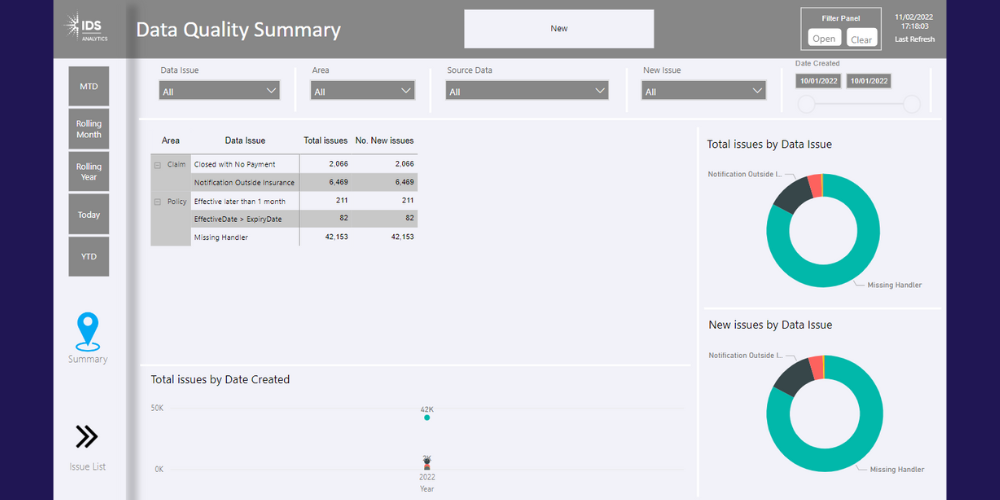
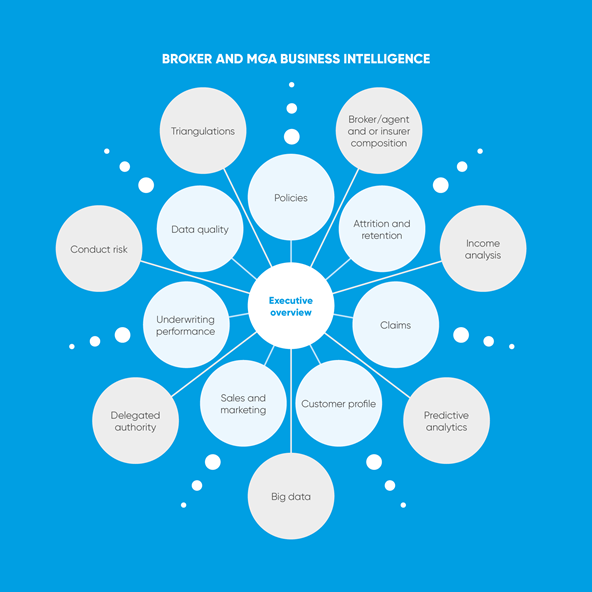
MGA Analytics
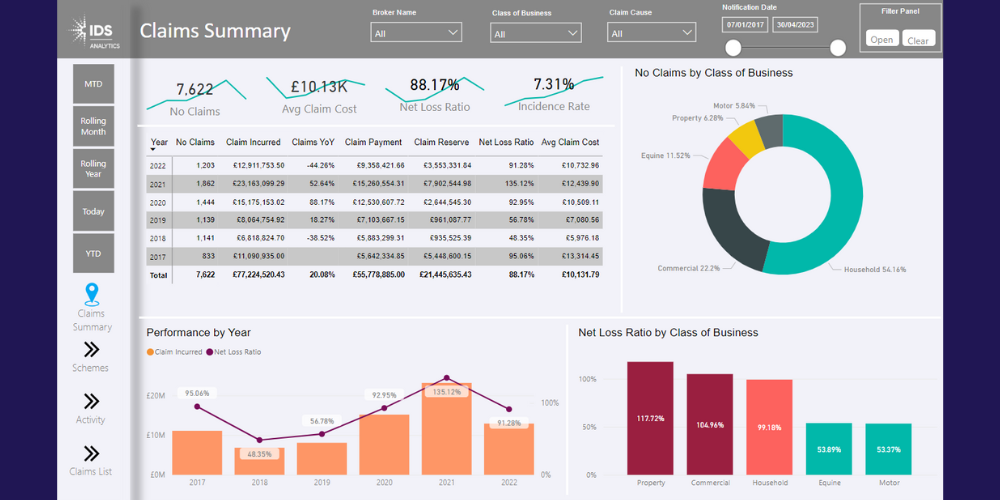
The dashboards and MI tailored for MGAs add a greater focus on risk and claims.
Monitor loss ratios, claim frequencies and triangulation's by segment and identify unfavorable trends as early as possible to maximise the time to intervene.
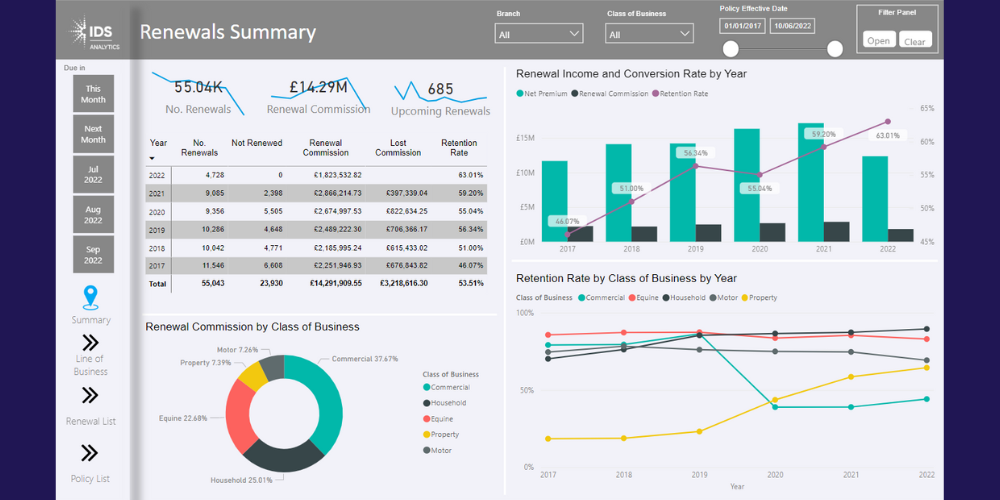
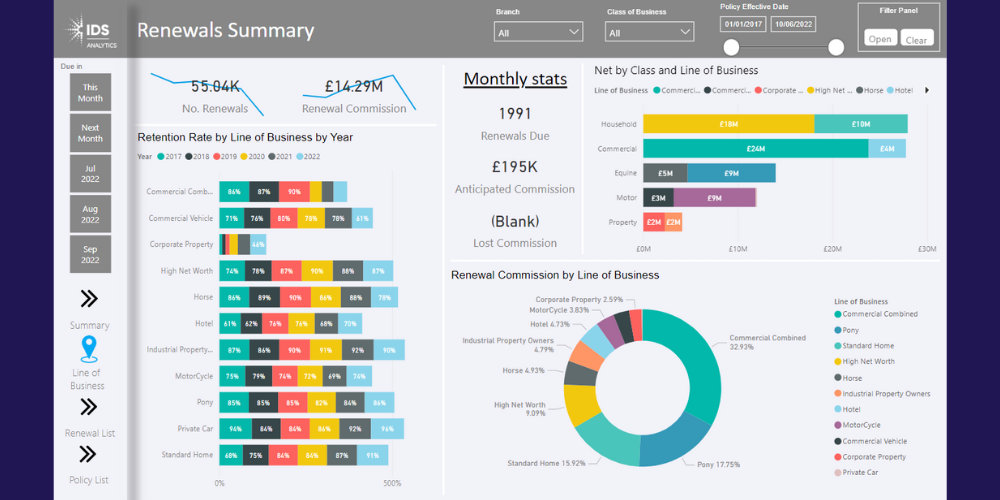
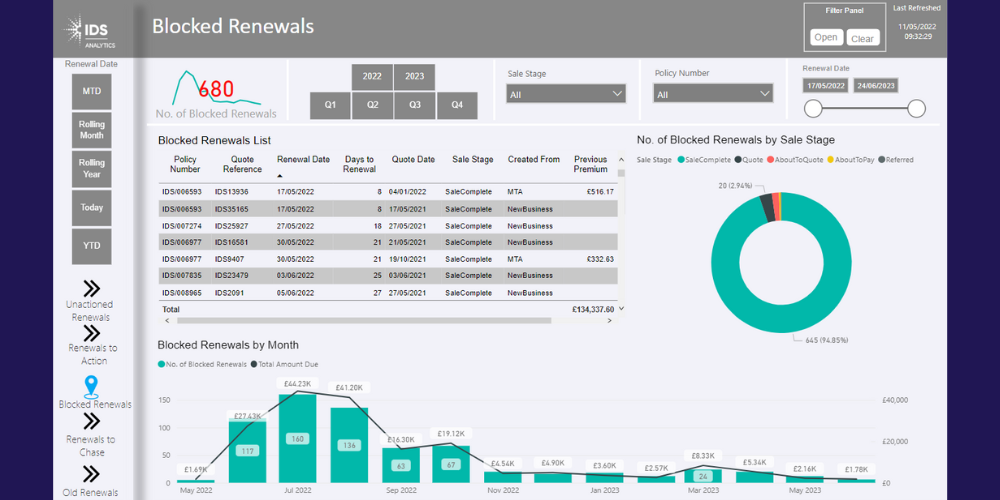
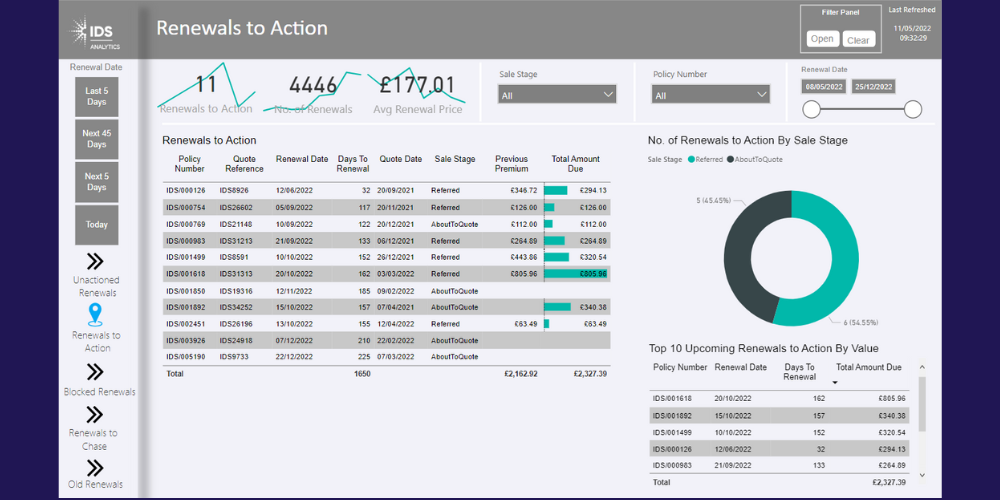
A detailed Broker pack allows each broker to be selected and to show all their key metrics including upcoming renewal volume and commissions.
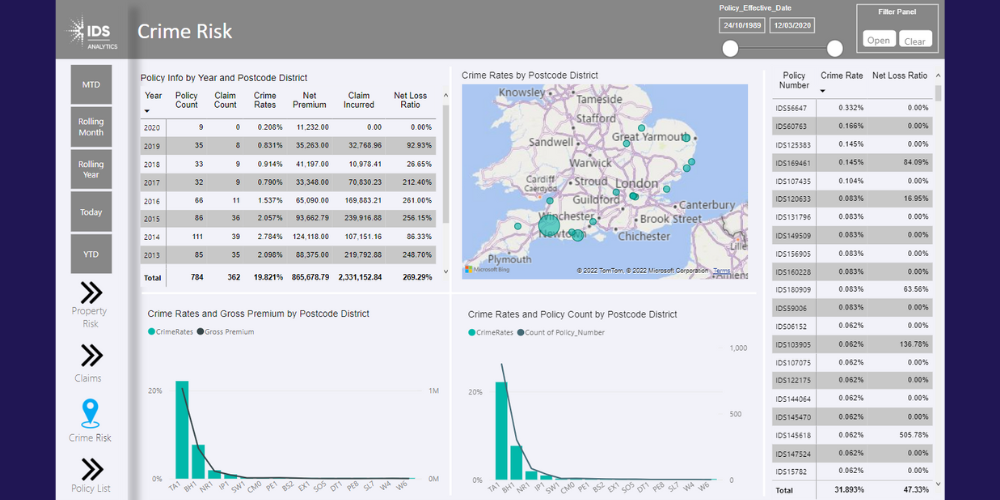
Track earned premiums and map risk exposure against enriched data such as flood areas and crime rates.
Better understand niche segments with data enrichment such as company information and report on conduct risk compliance requirements.
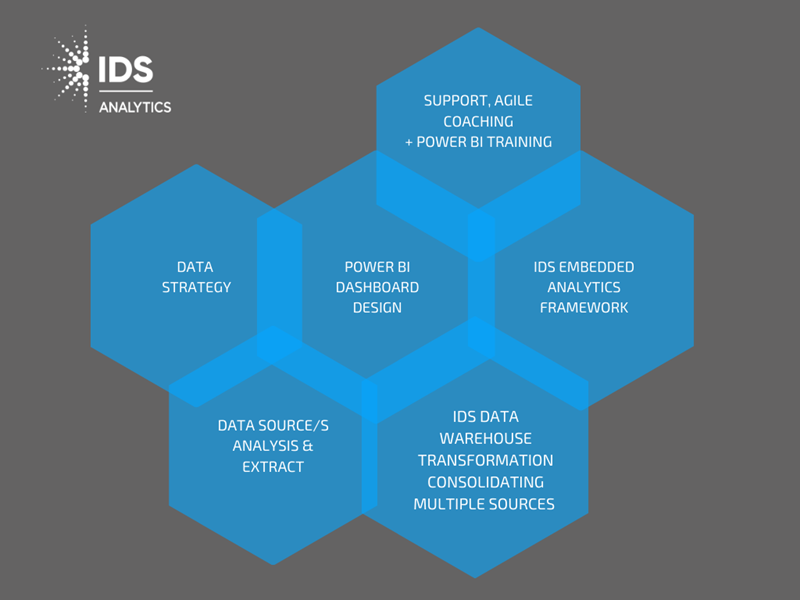
COST EFFECTIVE & FLEXIBLE SUPPORT
We are flexible and can connect your data sources to Power BI in several ways, by working with your IT department on your preferred option and in line with your data strategy.
We can merge multiple data sources into an IDS Data Warehouse, or we can connect a Power BI gateway directly to your database (e.g. Info Centre).
The Power BI PBIX files are yours, once they have been developed you can
a) Purchase Power BI Licences to publish and share internally, or
b) Utilise the cost-effective IDS Embedded Analytics Framework, giving unlimited users and partners access to specific dashboards on a self-service basis.

IDS Embedded Analytics Framework
The IDS Embedded Analytics Framework supports you in securely sharing dashboards and MI reports.
Benefits
- Access to relevant and up-to-date dashboards on a self-service basis for users, senior management, and partners.
- Providing a centralized cost-effective platform for accessing MI reports and dashboards
- Automating data refreshes (real-time, every 15 mins., daily, monthly)
- Control who sees what with role-based permissions
- Define and set threshold email alerts
- Reduce Power BI licensing costs with Unlimited Users
- PDF download based on filters
- Measure usage with full audit capabilities
- Easily share insights and track actions against findings
- Upload additional data sources for data enrichment i.e. ad-hoc spreadsheets / CSV files
- Training and Support
Data Enrichment Widens Insights on Customers and Risks
Correlating External Data With Insurance Data
There is an abundance of external data available today which can offer value,in gaining greater customer and risk insights and in identifying opportunities associated with your products.
The IDS Analytics solution enables you to enrich your data with external data to empower better decision making, for example;
- Commercial and market information can tell you, how well the business or sector is performing and help you identify fraudulent behaviors by analysing the close relationship between business performance and claims activities or buying patterns and claims for instance with mobile phone insurance.
- For MGA’s in the Property Insurance sector, the number of burglaries per head of a postal area and the trend as to whether this has been increasing or decreasing in recent months, which could have a direct influence on the rating of premium for contents insurance. Or how about tracking policy holders in flood risk areas, even when they declared they were not? Would your business discuss premium credit terms to a company with an adverse Companies House status?
- To ensure marketing campaigns are better targeted, enrichment of your customers can help you better understand their demographics or the commercial sector they operate in and therefore their needs. Do you know how long your commercial customers have been in business? Do your campaigns consider customer life-stage requirements and spending power?
Examples of Public and Private External Data Sources
- Commercial / Company data
- Flood risk areas
- Crime trend rates
- Individual, demographic, and lifestyle info.
- Location and property info.
- Risk information
- Nationwide market information
IDS can ensure the data is cleansed and in the correct format for loading into your dashboards.
TALK TO AN INSURANCE DATA EXPERT TODAY
Arrange a demonstration of the IDS Analytics Solution and discuss your specific requirements.